by María Tereda Alameda (UC3M) and Daniel Pérez del Prado (UC3M)
The salaries of teaching and research staff are set in Spain at a triple level: State, Regional Government and University. In all three, the projection of gender budgeting is, for the time being, very limited. However, at the third level (University), some instruments have been incorporated in the line of this logic and try to compensate the time dedicated to family care by women and, in a context of competitive excellence (increasingly publishing, better and in the shortest time), to prevent any damage from a salary perspective. These measures have been applied to permanent and non-permanent staff at the University but, for the second group, their effect is important as they do not have a high salary level.
Despite the implementation of this kind of measures, in Spain, gender wage gap (14%) is an important problem and some relevant regulations have recently been approved in order to overcome it (RD Law 6/2019, of March 1 and RD 902/2020, October 13). The second rule develops the first one and specifies so important aspects such as the criteria to be taken into account for comparative purposes –value of work (equal pay)- or the remuneration record – the key to achieve remuneration transparency, reduce the gender pay gap and eliminate salary discrimination against women-.
Within this framework, our project focuses on studying gender pay gap at Carlos III University (UC3M hereinafter). Particularly, the University has provided data on remuneration, distinguising among gender, wage bonuses and charge supplements.
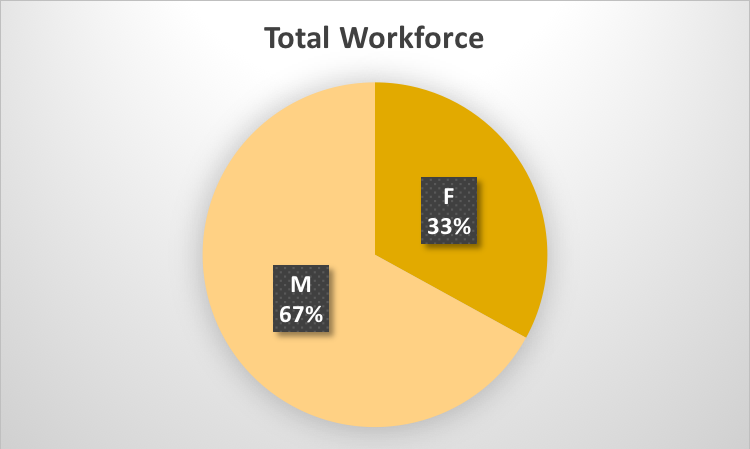
Before analysing this data, it is necessary to take into account the general structure of the workforce at UC3M. According to the following graph, employees are divided, from a gender perspective, in thirds. Concretely, male employees means two thirds of the total workforce, whereas female employees represents a third. This distribution is generally kept if it is distinguished between permanent and non-permanent employees. Whereas the first ones show a repartition of 60% and 40% respectively; the second ones gives figures of 34% and 65%. Hence, despite the small differences, we can assume that the whole workforce follows a gender distribution of two third-one third. This situation is particularly important in order to analyse the subsequent data and, particularly, to know if females o males are infra or supra-represented compare to their weight in the workforce.
Graph 1

Source: own elaboration based on UC3M’s data.
Consequently, keeping in mind this distribution, the following step is to know how salary supplements regarding charges are assigned. As it was explained above, charges can be remunerated or non-remunerated. Within the first ones, two types can be distinguished. On the one hand, those attributed by the University itself (general charges). On the other hand, those assigned by departments, institutes and other minor entities (specific charges). The following Graph shows the gender distribution of employees with remunerated charges. This includes all kind of employees, both permanent and non-permanent. As it can be seen, the repartition is slightly favourable to female employees as they have a representation which is 10 p.p. above their weight in the workforce.
Graph 2

Source: own elaboration based on UC3M’s data.
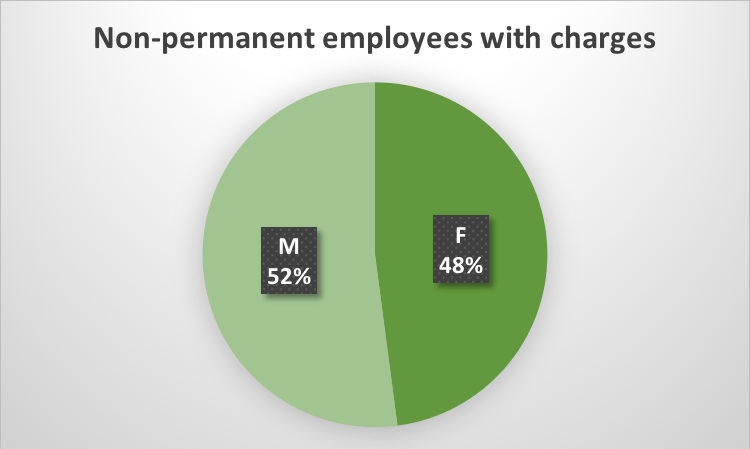
Nevertheless, the situation can be even better. Whether it focuses on non-permanent employees (Graph 3), this difference increases up to 15 p.p. This means that, among non-permanent employees, charges with wage supplements are distributed almost equally. This apparently good news can hide, however, a perverse effect linked to the idea that charges could be used to compensate structural precarity. If female employees are worse remunerated or have more unstable (and worse paid) positions than male employees, this more balanced situation could show, not a higher consideration, but an officious form of compensation (Steinþórsdóttir, Einarsdóttir, Heijstra, Pétursdóttir, and Brorsen Smidt, T. [2019]).
Graph 3

Source: own elaboration based on UC3M’s data
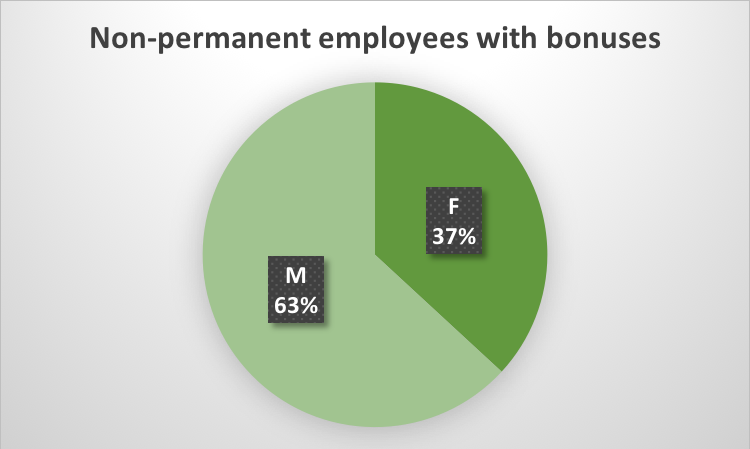
If it pays attention to wage bonuses, the following two graphs show the distribution among females and males employees for the total workforce and for non-permanent employees. This includes all types of wage bonuses, that is, those which are recognized by the collective bargaining agreement and those which assigned according to the UC3M’s wage incentive program. The first ones are quite stable and provide a flat amount of money which is distributed almost proportionally. As a consequence, most important differences are explained by the type of contract and the wage incentive program. Here, we are going to focus on the program solely.
Graph 4

Source: own elaboration based on UC3M’s data
Graph 5

Source: own elaboration based on UC3M’s data
As it can be seen, the proportion of bonuses for both the whole workforce and non-permanent follows a distribution which is quite similar to the weight of each sex in the whole workforce. This means that, if differences exist, they must be connected to the type of bonus which is assigned to each group, but not with the number. As a consequence, our analysis also aims to determine who the different levels of bonuses are distributed among female and male employees, besides the remuneration assigned to each kind of contract excluding bonuses.
